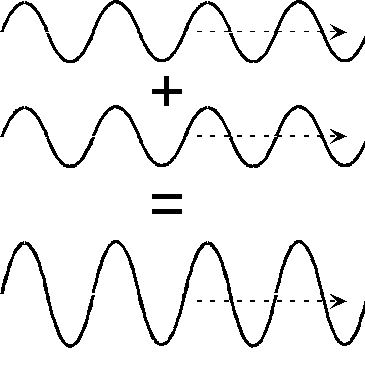
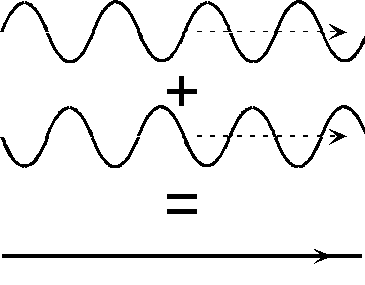
Upper-atmospheric eddies (storms) are not usually isolated incidents - they occur imbedded in fluid flow regimes that are made up of waves of many different frequencies interacting in various ways. If two or more waves share a common phase as they overlap, they will amplify the flow, and if they're out of phase, the flow will flatten and energy will be lost.
Holton (2004) demonstrates that for a fluid flow with Earth-like atmospheric conditions, the group velocity of these interacting Rossby waves will always be positive (eastward) and larger than the speed of propagation of any individual Rossby wave. Since the function of all atmospheric eddies is to equalize differential heating and radiate energy, this implies that the vast majority of energy fluxes exiting an eddy should radiate downstream. In fact the process of "downstream development" is frequently observed in the atmosphere and is commonly linked to high impact weather events (Chang, 2005; Lackmann, 2005), regime changes (Archambault, 2011), large sensitivity of models to initial condition estimates (Majumdar, 2010), and the downstream propagation of model errors (Hakim, 2005). In fact, Chang (2001) and Hakim (2003) revealed that, in the midlatitudes, the downstream development phenomenon tends to organize into wave packets - clusters of highly amplified flow moving eastward rapidly along a waveguide (usually a mid-latitude jet stream).
The benefit, therefore, to tracking the downstream propagation of wave packets could be critical to improving model forecasts. What is needed, then, is a way to see Rossby wave energy independent of the wave-like structure (the troughs and ridges an eddy creates in the flow). Zimin (2006) showed that the most reliable method for picking out the amplitude of the envelope enclosing a wave packet is to find a proxy for the eddy energy (such as meridional wind or height anomaly) and run it through a Hilbert transform to isolate relevant wave number flows associated with wave packets. He further suggested that the assumption be made that wave packets were perturbations in a long-term mean flow and that would propagate according to that mean. A example of 300 hPa meridional wind on 03 March, 2009, the 14-day running average meridional wind, and the result of Hilbert transforming the difference, which we call wave packet amplitude (WPA).
This process can be repeated for each model cycle and for every member of the GEFS (Global Ensemble Forecast System) and the resulting model forecasts for wave packets studied in several ways. That is what this website is dedicated to making available for the forecaster.
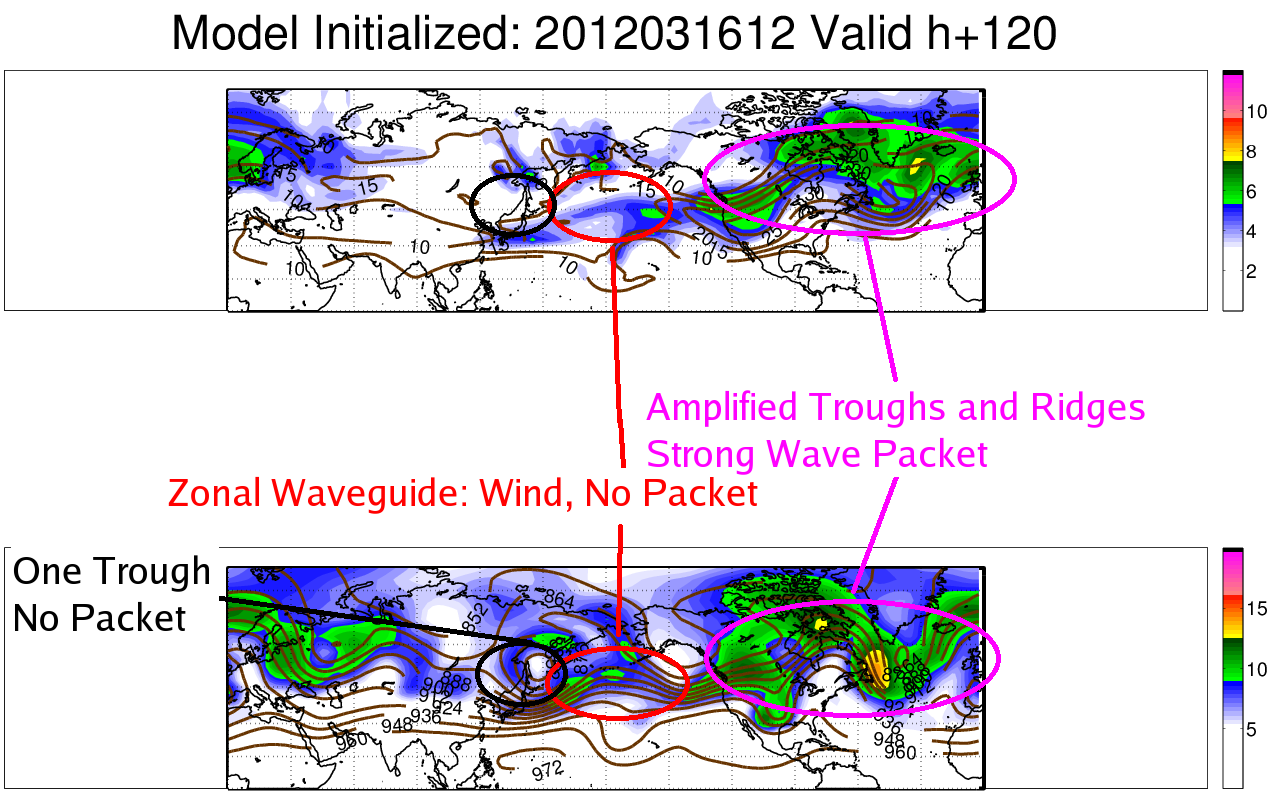
The above image is an example of the products available at this website. Depicted are (TOP) GEFS mean wave packet amplitude, contoured every 5 m/s, and the GEFS ensemble spread in WPA in the shading and (BOTTOM) GEFS mean 300 hPa height, contoured every 12 dam, with the square root of ensemble spread in height shaded. We choose to take the square root of height spread because height errors in the model forecast are generally in a roughly quadratic distribution. I have circled a few points in the figure to draw your attention to ommon features within this type of plot. The most impressive wave packet is located in the North Atlantic and over North America and the region of highest WPA is colocated with a series of very amplified troughs and ridges. In the Pacific, there is a strong jet, but the flow is very zonal, leading to a lack fo a wave packet signal in the WPA field. Over Eastern China and Japan, there is an amplified trough, but that trough is isolated, having not yet begun to propagate downstream. There is a lack of a strong jet to its west and the zonal waveguide to its east, meaning, without accompanying amplified ridges, it does not produce a wave packet signal at this time.
Also note that the regions of greatest uncertainty in the 300 hPa height forecast from this GEFS run are well colocated with the regions of large spread in the WPA forecast (and to areas with high WPA in general). Such large scale structure is not readily apparent in the height spread graphics alone.