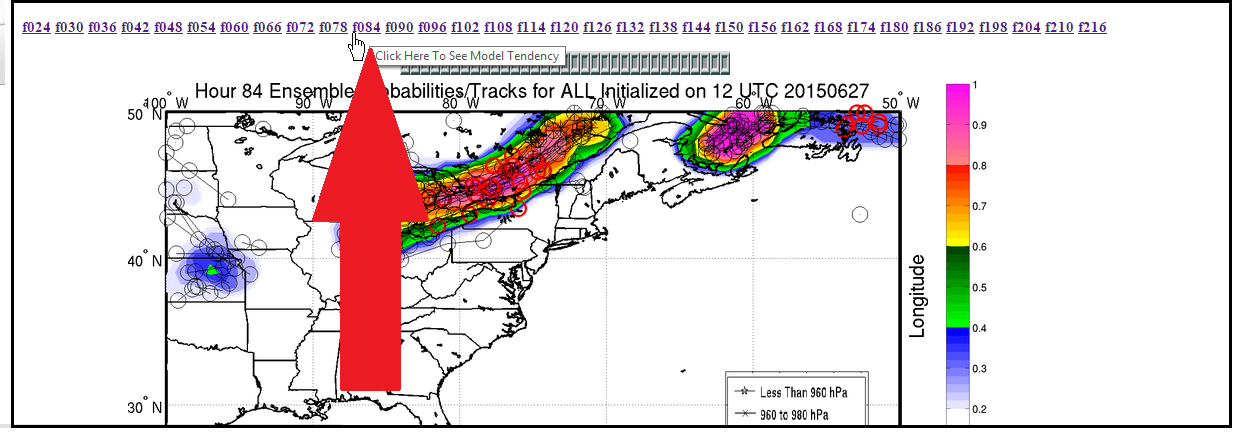
All graphics displayed by forecast hour (i.e. "f048") also contain a link to show model trends centered on that forecast time. For example, holding your mouse over the forecast hour will advance the images but clicking on the forecast hour (image below) will display model tendency:
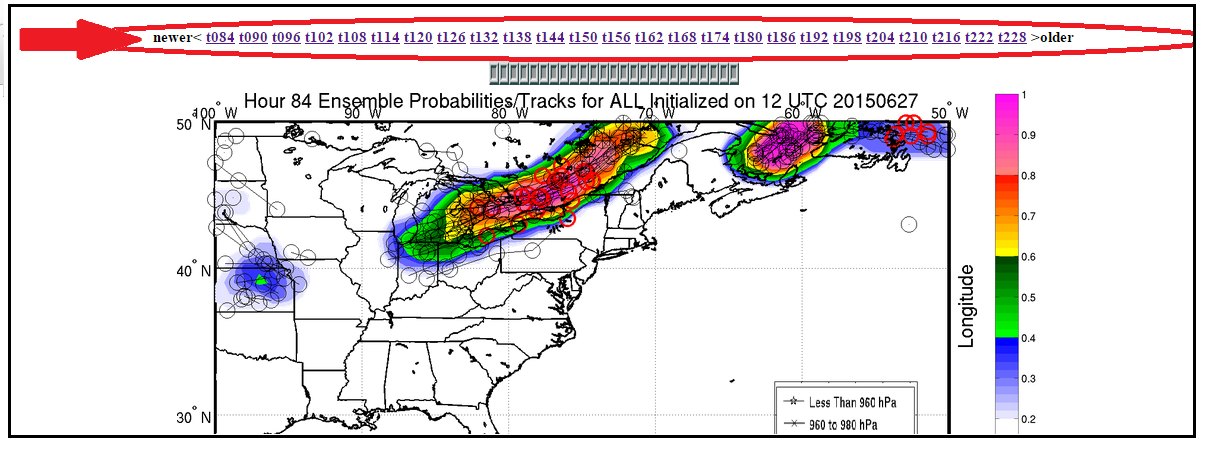
Model tendency graphics are focused on one valid time (image below) and show how the forecasts have evolved for that particular time over the previous 10-days.
Questions or comments? Email me: Michael.Erickson@stonybrook.edu.