Okay, So What Am I Looking At? Additional Details - The Ensemble Used Additional Details - How Often Do the Images Update?
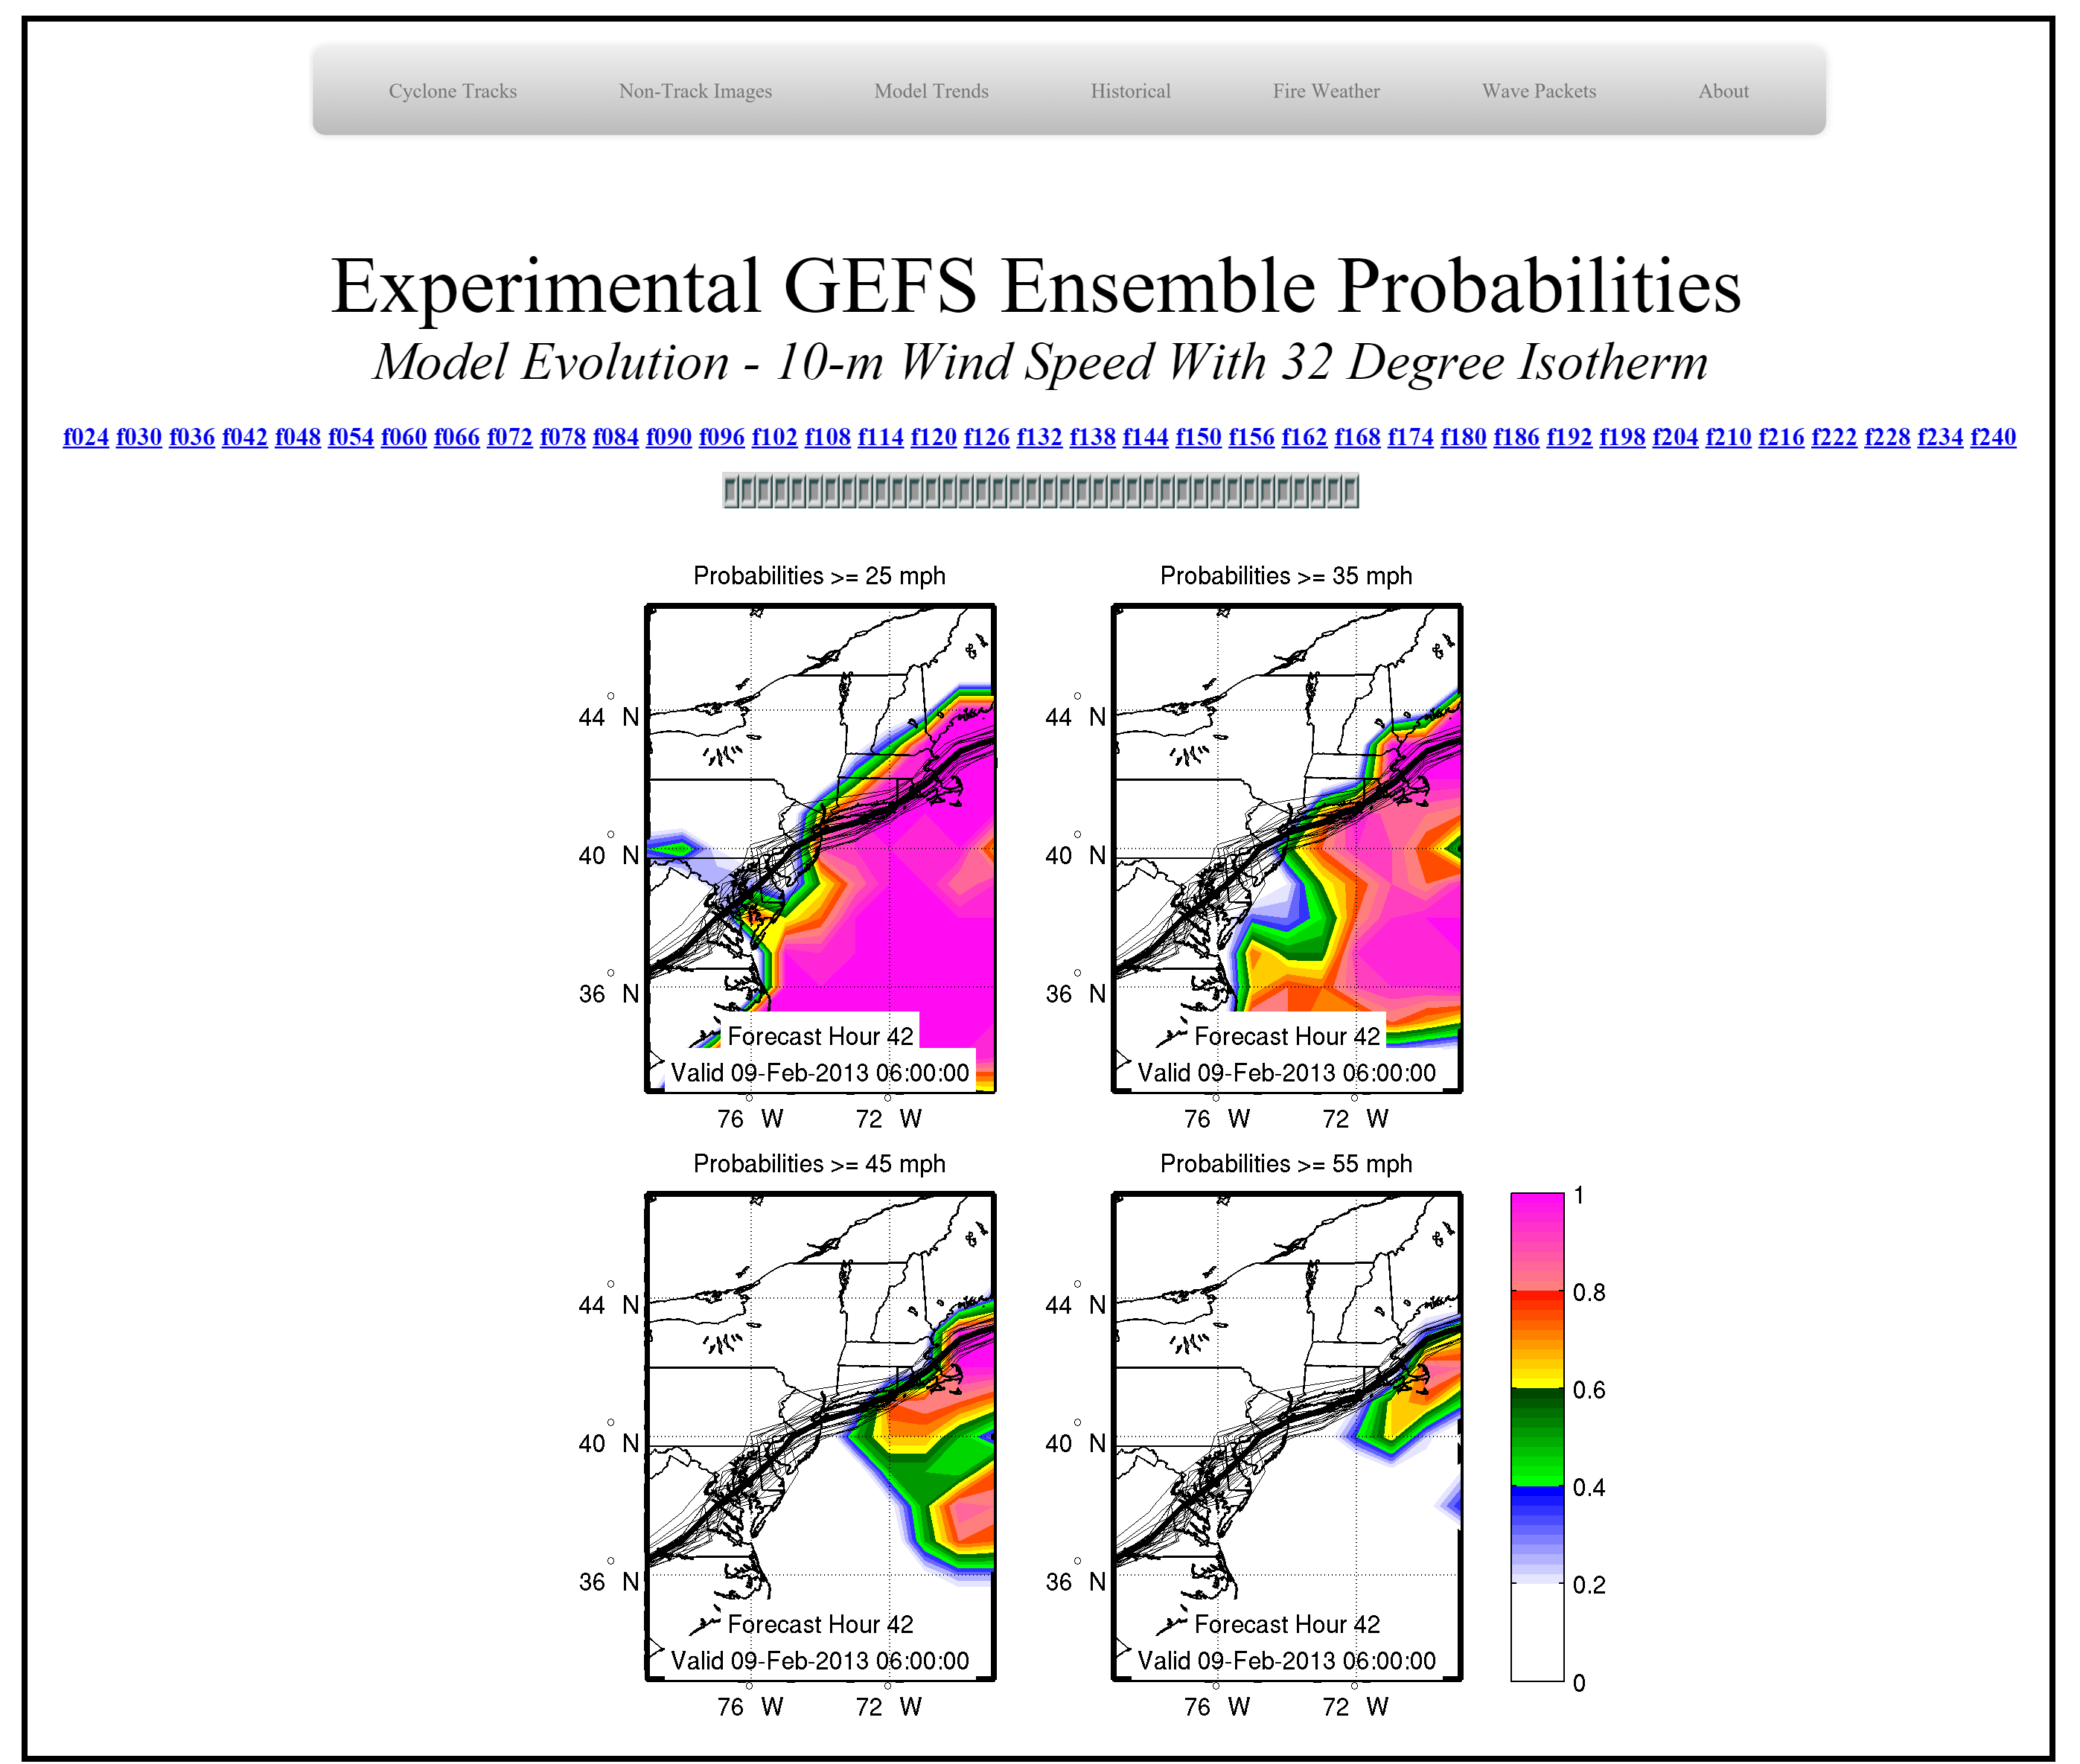
These "Model Evolution" graphics display the instantaneous 32 (90) degree isotherm in winter (summer) along with the ensemble derived probability of exceeding various thresholds of wind speed (25, 35, 45, and 55 mph.) The thin lines are for each ensemble member, while the thick lines are for the ensemble mean. The image above shows the 42 hour forecast for the Global Ensemble Forecast System (GEFS) initialized on 12 UTC 07 Feb 2013. The strongest probability of high winds (> 55 mph) at 06 UTC 07 Feb 2013 is over Cape Cod/Nantucket, which lies to the southeast the 32 F isotherm (i.e. the temperature is above freezing in the model.)
The forecast evolution of cyclone tracks can be advanced by mousing over the forecast hour in blue above the image. Model tendencies (i.e. trends) can be assessed by clicking on that forecast hour, as explained in the Model Trends How-to.
"6 Hour Wind Speed with the 32/90 Isotherm" images are created for 4 unique ensembles: the Global Ensemble Forecast System (GEFS), the Canada Meteorological Center (CMC) Ensemble, the Fleet Numerical Meteorology and Oceanography Center (FNMOC), and the Short Range Ensemble Forecast System (SREF.)
These images are generated as soon as the ensemble data becomes available. The GEFS and SREF ensembles update four times a day from their 00 UTC, 06 UTC, 12 UTC and 18 UTC runs. The CMC, FNMOC and UKMET update twice a day from their 00 UTC and 12 UTC runs. Cyclone track data for the SREF, GEFS, UKMET, NMMOC and CMC are available about 5, 7, 7, 8, and 10 hours after model initialization, respectively.